

You’re skilled at looking at a spreadsheet of data or complex programs and being able to make sense of it all. However, not everyone in business has that same skill, which is why the data visualization systems you create are essential.
Now it’s time to help hiring managers visualize why you’re the right candidate for their needs by writing a great cover letter and resume.
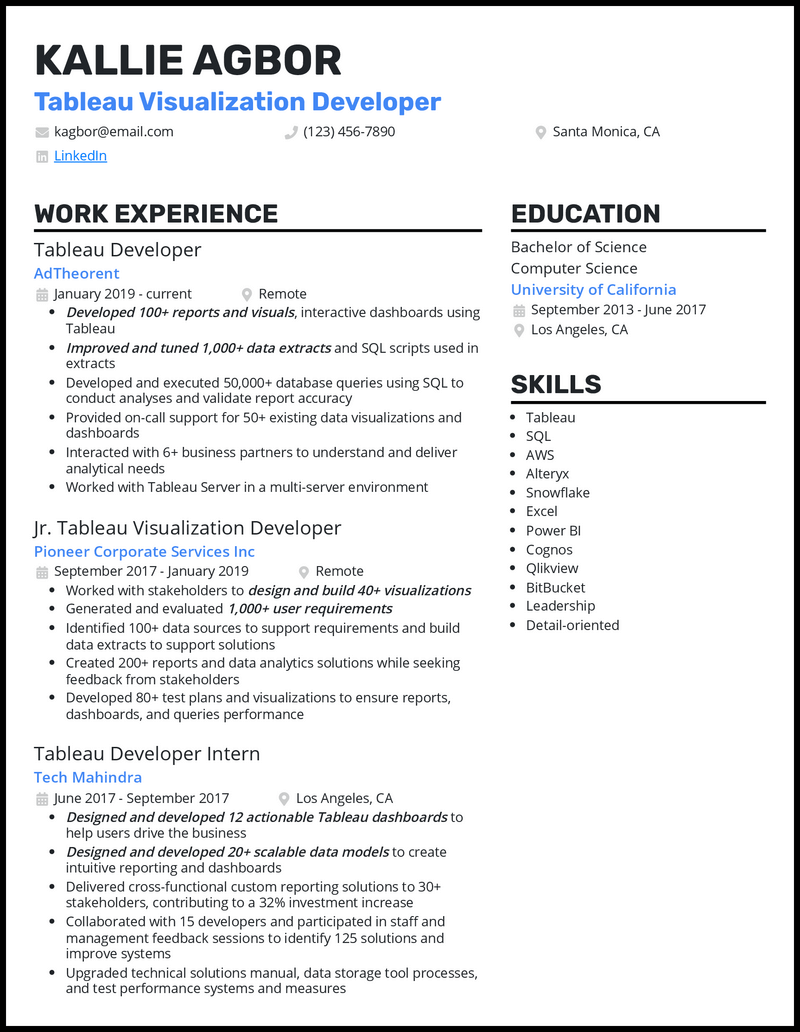
If you’re struggling to compile all the data about your top skills on a short one-page resume, look no further than our data visualization tableau resume examples. They’re excellent resume templates that will successfully portray your abilities.


Related resume examples
What Matters Most: Your Data Visualization Tableau Skills & Work Experience

You have tons of skills and can successfully operate several programs like Tableau, NumPy, and Rally. That said, how do you narrow in on the right skills to put on your resume?
Each company you apply to will have slightly different data management needs. Some companies may be interested in trend identification, whereas others will care most about client support.
You should tailor the skills you list to the needs of each company. For example, implementing logarithmic systems would be great for trend analysis, and improving UI may be necessary for client experience management.
Here are some top data visualization Tableau skills in 2026.
9 top data visualization tableau skills
- Tableau Servers
- Microsoft SQL
- Python
- NumPy
- Crystal Reports
- Client Support
- Document Generation
- QA Methodologies
- Dataset Patterns
Sample data visualization tableau work experience bullet points
Data optimization is a top concern for companies who use it for their most crucial decisions. That means they’ll want to see how the programs you develop will help them succeed.
Data is your primary focus, so you’re an expert on business metrics and how they lead to success. Use that to your advantage to create some awesome metrics-based examples of how your programs improved process efficiency or led to additional sales revenue.
Additionally, you have a technical role, but it’s best practice to keep these examples simple. One sentence about how you use Crystal Reports to organize BI data can go a long way.
Here are a few samples:
- Monitored performance metrics on Tableau dashboards to ensure 99% data accuracy and integrity throughout operations.
- Implemented chart visualizations in Tableau, including dual-axis and box plots, to improve data comprehension by 65%.
- Ran SQL queries against current databases for 85% more accurate data analysis.
- Used QA methodologies to create Tableau dashboards for design teams, reducing product defects by 79%.
Top 5 Tips for Your Data Visualization Tableau Resume
- Your technical skills matter most
- Designing visuals in Tableau requires tons of technical skills and knowledge. Therefore, abilities like programming in Python and understanding dataset patterns should be the primary focus of your resume.
- One-sentence descriptions work best
- Hiring managers have tons of resumes to review. Therefore, simple one-sentence examples make it much easier for your primary abilities in Tableau and NumPy to stand out while they’re quickly sorting through the multitude of applications.
- Keep it organized
- Since your job will require you to create organized data visuals, having a well-put-together resume will be essential to your success when making a first impression. Optimize by using a resume template with clear headers, bullet points, and an easily readable font.
- Use proper formatting
- Reverse chronological formatting is the best fit for data visualization Tableau applicants. Technology is continuously being updated, so your most recent experiences with Tableau dashboards and data compliance standards will be the most relevant and should be listed first.
- One page is an optimal length
- You should always aim for a concise one-page resume to avoid losing a hiring manager’s attention. Keep it to three or four jobs that are the most recent and relevant to the position and narrow in on the position’s biggest needs, like using Tableau servers.
Action words are verbs like “monitored” or “developed” that help you speak in an engaging and active language. They’ll make your examples stand out, such as saying you “monitored data across 62 company locations to ensure all compliance standards were met for three years.”
A resume summary works well when you have ten or more years of experience. For example, you could write a couple of sentences on how your Tableau data visualization dashboards have helped companies boost productive efficiency by an average of 72% over your 11-year career.
The best way to stand out is by customizing your resume to each job’s needs and using many relevant metrics. For instance, if a company needs help with multi-client support, you could explain how you use data warehousing to boost multi-client data accessibility by 64%.

Stephen is the co-founder and CEO of BeamJobs. Frustrated with the challenges he'd faced in his own job search, he left the corporate world to start BeamJobs with his brother. Drawing on firsthand experience with hiring and getting hired as technical talent, he started BeamJobs in 2020 to help qualified job seekers land interviews with less stress. Since then, more than 4 million people have built their resumes and cover letters on BeamJobs. Stephen's insights have been featured in notable outlets, such as Fast Company, Business Insider, Yahoo Finance, MIT, and Zapier. Learn more about Stephen.