


I spent six years as a data analyst before I quit to start BeamJobs. Early in my career I constantly struggled to decide which skills I should focus on learning or which skills I should improve to advance my career.
So with this post, I’m going back to my roots of data analysis. What better way to figure out what skills you should learn to be a successful data analyst than by looking at the data?
For this analysis, I looked at 200 data analyst job openings in the US and parsed out what technical skills each company was looking for in their job description. Here are the top-level conclusions:

SQL

SQL is explicitly required in 90% of the data analyst job openings we analyzed. This makes sense since companies store all of their data related to their website in a database.
SQL (Structured Query Language) is the language you need to speak to be able to get data from databases. Without SQL you won’t be able to access the data you’re going to need to perform any substantial analysis. It’s a prerequisite to doing analysis.
If you’re going to focus on learning or improving one skill as a data analyst it should be SQL. If you’ve never written a query before now is a great time to learn. I personally used SQLZoo when I was first learning and I highly recommend it (it’s free).
90% of a given analysis project entails accessing the right data to answer the question at hand then cleaning and preparing that data for analysis. SQL drastically simplifies this process since if you write a query once you can use it across many different projects.
Nearly all job interviews for data analyst positions have a technical component where you’ll be asked to write SQL queries. When I leveled up my SQL skills I was able to ace these interviews and increase my compensation by over 100%.
More than just helping you get a great data analyst job, SQL is also a great introduction to the world of programming. To get data from a database in the format you need for analysis you’ll need to think logically and thoroughly about the queries you write.
My final point to convince you to learn or improve your SQL skills is that it will save you so much time. The beauty of SQL is that, unlike Excel, SQL is entirely scalable and repeatable. You can hand your query off to another analyst and they can quickly understand what’s going on. Trying to understand an Excel workbook that someone else hands off to you can be time-consuming and confusing.
Business Intelligence Tools

There are an uncountable number of business intelligence tools on the market right now. The good thing about BI tools though is that once you know one, you can quickly learn others. Which one should you focus on learning?

Tableau was the BI tool of choice for 46% of the data analyst job openings in our dataset. Tableau has free training lessons and it’s easy to get started so this is what I recommend you learn first.
What do BI tools actually do? Simply put they make scalable data visualizations accessible to non-technical business stakeholders. Once an analyst creates a data visualization in a BI tool the underlying data can automatically be refreshed so anyone in a company can get real-time insights into the metrics they care about.
To get the most utility out of BI tools an analyst will need to use SQL. I want to make the point again that, if you don’t know SQL, that’s undoubtedly the skill you should learn first!
From my experience, if you become really good with the BI tool your company uses then your perceived (and actual) value within the company will skyrocket. Good organizations know that data should be at the heart of all decisions they have to make and if you are the one that can make that data accessible and usable then you become an asset to the organization.
If you know SQL and a BI tool like Tableau you’ll be able to succeed in many data analyst roles. These are the two major requirements for most companies looking to hire a data analyst. If you know these two skills then you’re well on your way to a successful data analyst career.
If you want to take the next major step in your data analyst journey, you’ll need to learn a programming language.
Programming Languages

Once you have the data you need from a database using SQL, it’s time to actually analyze that data for the project you’re working on. Now it’s time to use a programming language. Which language is the most popular for companies hiring data analysts?

You can see its neck and neck between Python (40%) and R (30%) between the job openings we analyzed. The Python vs R debate is a fierce and hotly debated topic in the data community. Frankly, you can’t go wrong learning either.
I personally started with Python then picked up R on an as-needed basis for specific projects. Learning Python or R has a steep learning curve but once you get the hang of it you’ll wonder how you ever used Excel for analysis before.
For me, the biggest benefit of using a programming language for analysis instead of Excel is that it’s much easier to check your logic and fix bugs in your analysis. I can’t tell you how many times I opened an old Excel workbook I used for an analysis and had to spend hours figuring out what I did.
With Python or R you can review the code you wrote and figure out exactly what you did. This means it’s easier to share your work with other team members. It also drastically increases the speed with which you can do new analyses to test new assumptions.
Python and R also have libraries and packages built in that make more sophisticated analyses much easier to do. Here are those libraries and packages ranked in order of how important I think they are for data analysts:
- Python (they’re libraries in Python)
- Pandas (for data manipulation and data preparation)
- Matplotlib (for plotting and data visualization)
- Scikit-learn (for more advanced modeling like regressions and decision trees)
- Numpy (a lower-level library for data manipulation)
- R (they’re packages in R)
- Dplyr (for data manipulation and data prep)
- Ggplot2 (for data visualization)
There are amazing free resources online to learn Python or R specifically with data analysts in mind. You can start with Coursera then tackle some projects on your own.
Python really clicked for me once I wanted to answer some of my own questions around fantasy football of all things. There was a lot of Googling to solve my specific problems but it really took my programming ability to the next level when I didn’t have the guard rails of a course to guide me along.
Excel

While I have bashed Excel a bit in this article for scalable, repeatable analysis demonstrates it still very much has its place for data analysts. Forty-two percent of job openings still require data analysts to know Excel.
The primary reason for this is that Excel is the tool most often used by business leaders for any quantitative analysis. It’s the common numerical language across the entirety of a company.
For me, the biggest use case of Excel was when I wanted to create interactive models or tools for my non-technical colleagues. When I wanted to empower the team to change assumptions in a given analysis and see the outcome, I used Excel.
Excel is also really good for quick and dirty analysis. The best way to learn Excel is to get your hands dirty. There are thousands of resources online to learn Excel for beginners and advanced users since it’s a ubiquitous tool in business.
ETL

The most surprising result for me from this analysis was that 20% of the data analyst job openings we analyzed wanted candidates to be comfortable with ETL processes. Most (60%) of these jobs had ETL experience as a nice-to-have instead of a requirement.
ETL (extract, transform, load) is essentially the background process that takes data from an application and makes it so that it can be uploaded into a relational database.
When you write a SQL query you’re doing so against a relational database with a well-defined table and column structure. ETL processes get the data to a place in which you can write SQL to pull it from a database.
To build a data pipeline you need to have really strong programming skills (namely in Python, Java, or C++) and need to be really strong with SQL. Most larger companies have entire teams of data engineers that build data pipelines so this would be towards the bottom of the skills you should learn.
Statistics

Only 12% of the companies in our data require that data analyst job candidates know statistics (or some statistical technique). I think just looking at this number undersells the value of knowing statistics as a data analyst.
When you want to move beyond top-level analysis you’ll need to incorporate statistics into your toolkit. Want to do data science or machine learning? Statistics provides the theoretical underpinning of both those disciplines.
What kind of statistical techniques or concepts should you focus on? Here is my short-list for where I think you should start:
- A/B and multivariate testing
- Significance testing
- ANOVA
- Regression (linear and logistic)
Knowing both the theory behind these concepts and how you can implement them in code (using Python or R) will help you take your analysis to the next level. I would focus on these concepts more than learning ETL skills.
Data Analyst Skills on a Resume

When it comes time to include your data analyst skills on your resume you’ll want to do two things:
- Include a list of your skills in a dedicated “skills” section of your resume
- Include your skills in context when describing your work experience or projects
For your skills section, you should not have a long laundry list of skills (keep it to under 5). Only include skills that you would be comfortable answering questions about in an interview. For example, if you don’t have confidence you’ll be able to write a SQL query in an interview, don’t include SQL on your resume or cover letter.
When you’re talking about the data analysis projects you’ve worked on in class or in a job, it’s important that you mention the tools you used to complete that analysis. If you’re looking to build your data analyst resume we’ve written an extensive guide to help you out.
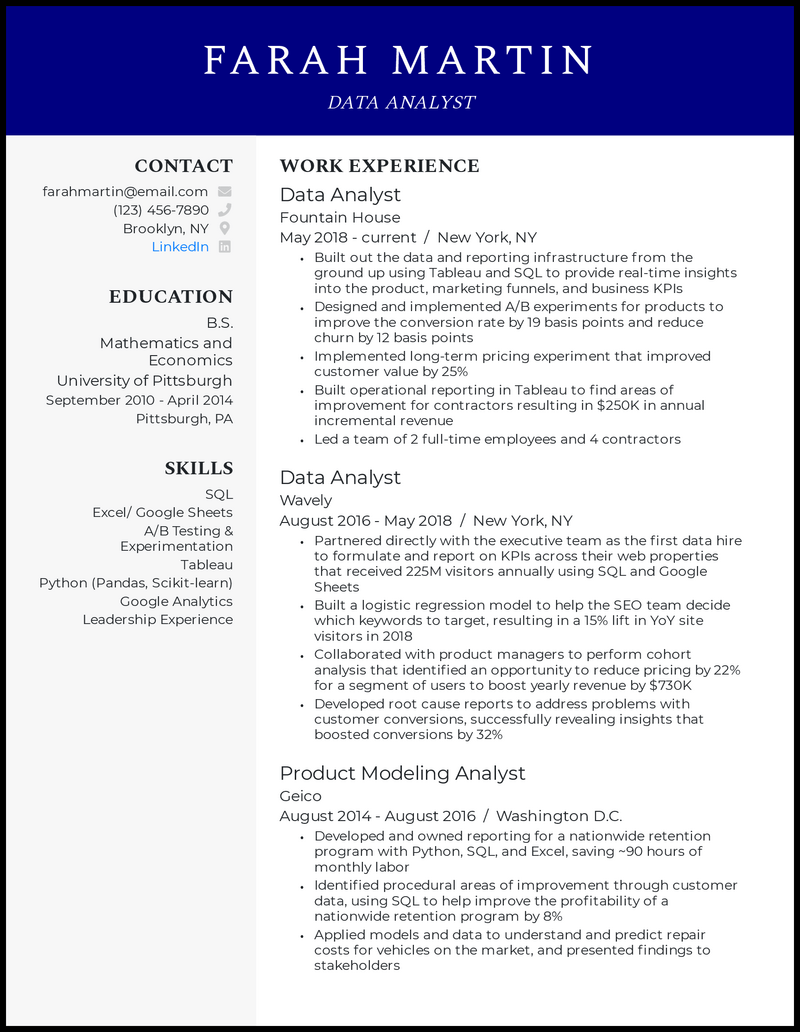
Here’s a great data analyst resume example you can emulate. If you’d like to see other resume examples we’ve compiled over 150 great resumes to give you some inspiration.
Data Analyst Resume

Stephen is the co-founder and CEO of BeamJobs. Frustrated with the challenges he'd faced in his own job search, he left the corporate world to start BeamJobs with his brother. Drawing on firsthand experience with hiring and getting hired as technical talent, he started BeamJobs in 2020 to help qualified job seekers land interviews with less stress. Since then, more than 4 million people have built their resumes and cover letters on BeamJobs. Stephen's insights have been featured in notable outlets, such as Fast Company, Business Insider, Yahoo Finance, MIT, and Zapier. Learn more about Stephen.