


We collected and analyzed employment data by race for 57 of the biggest tech employers in the US (1). Here are the top-level conclusions:
- Black and Hispanic/Latinx employees are significantly underrepresented in tech relative to their overall percentage of the US population.
- 67 percent of tech companies are made up of less than 5 percent of Black employees.
- Controlling for overall racial disparities in tech hiring, white employees are significantly over-represented in leadership positions while all other racial groups are underrepresented.
- Despite all US companies with at least 100 employees having to file an EEO-1 (which shows the racial composition of their employee base), only 16 of 57 companies have recently made this data public.
- There are ways to encourage companies to be open about diversity.
White Employees Overrepresented in Tech Leadership

It seems to be well-known that racial minorities are underrepresented in tech relative to their makeup of the US population. This is the hunch that led us, a resume builder company, to explore this data in the first place.
What might be lesser known is that racial minorities are heavily underrepresented in tech leadership roles even when you control for the fact that they’re underrepresented at these companies as a whole.
What does representative leadership in a company mean? It simply means you’d expect the racial makeup of leadership in a company to resemble the overall racial makeup of that company. Simply put, if 10 percent of a company is made up of Black employees then equal representation means that 10 percent of leadership is also Black.
That is largely not the case in our data. The diagonal line in the scatter plots below demarcates representative leadership within a company. If a company is above the line for a given race, that means a larger percentage of leadership is that race relative to the overall makeup of the company (over-representation in leadership). Conversely, if a company is below the line, then leadership is underrepresentative of the racial makeup of the company (underrepresentation in leadership).
Comparison between racial composition of employees at tech companies relative to racial composition of leadership at companies
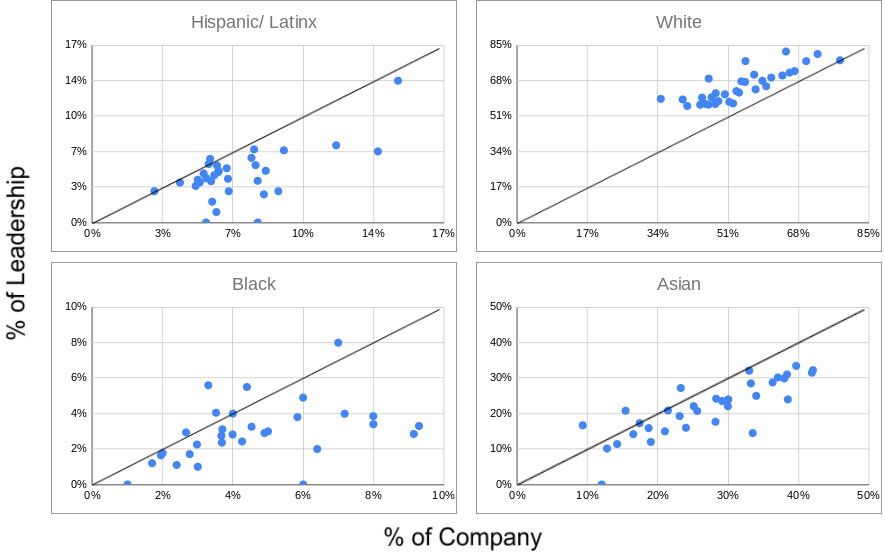
You can see that nearly 100 percent of companies in this dataset have an over-representation of white employees in leadership positions relative to the percentage of those companies overall that are white. All other racial groups are largely underrepresented in leadership:
- 94 percent of companies underrepresented Hispanic/Latinx employees in leadership positions
- 82 percent underrepresented Black employees in leadership
- 91 percent underrepresented Asian employees in leadership
How does this representation change when we aggregate this data across companies? For this comparison, I limited my analysis to the 16 companies that recently released an EEO-1 (3). We created a single metric to convey whether a given racial group has equal representation in leadership relative to their overall representation in these companies.
To do this, I divided the percentage of leadership across all companies that are a given race by the percentage of employees at these companies that are a given race. So if in aggregate, these companies have equal racial representation between employees and their leadership, this metric will have a value of one. Over-representation in leadership will have a value greater than one and underrepresentation will have a value less than one.
Total racial composition of leadership at tech companies divided by total racial composition of employees at companies
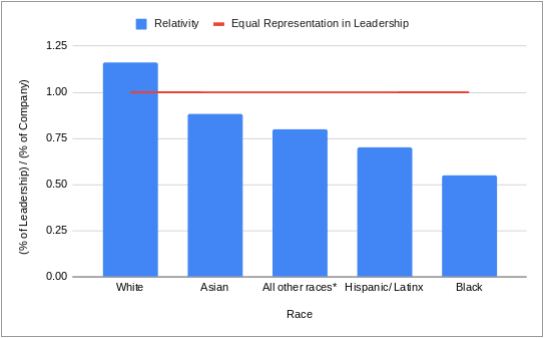
This demonstrates that white tech employees are the only racial group over-represented in leadership in aggregate (as we’d expect from the scatter plots). All other racial groups are underrepresented. More than that, it shows that a white employee at a tech company is twice as likely as a Black tech employee to be represented in a leadership role.
A white employee at a tech company is twice as likely as a Black tech employee to be represented in a leadership role.
Another way of putting this is if 10 percent of a tech company is made up of white employees, you’d expect 12 percent of the leadership of that company to be white. If 10 percent of that company were Black, you’d expect only 6 percent of leadership to be Black.
Employees of Color Underrepresented in Tech

Not only are employees of color underrepresented in leadership positions in tech, but they’re also underrepresented in tech in non-leadership positions. For this analysis, we looked at the employee counts by race for 35 US-based tech companies (4) and compared them to the overall racial makeup of the US population (5).
Racial distribution of tech employees relative to US population
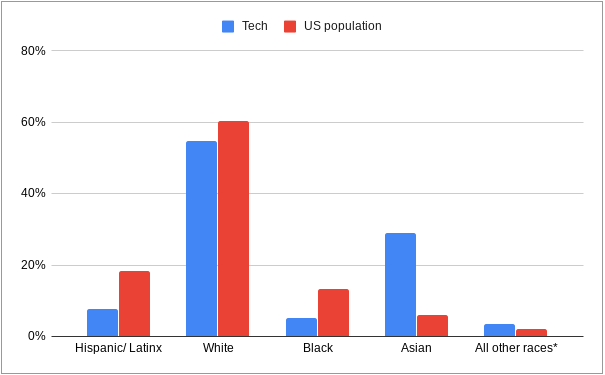
Hispanic/Latinx and Black people are the most underrepresented in tech relative to their representation in the US. While Hispanic/Latinx make up 18 percent of the US population, they only account for 8 percent of employees in tech in our data. Black people make up 13 percent of the US population but only 5 percent of employees in tech. Conversely, while Asian people make up 6 percent of the US population, they comprise 29 percent of tech employees.
The bar chart above looked at aggregated data across 35 of the largest US-based tech companies. To avoid smaller companies in our data being drowned out by larger companies, I also wanted to look at representation of Black employees in tech while controlling for company size. To do that, I bucketed companies based on the percentage of their employees that were Black.
Number of tech companies by percent of Black employment
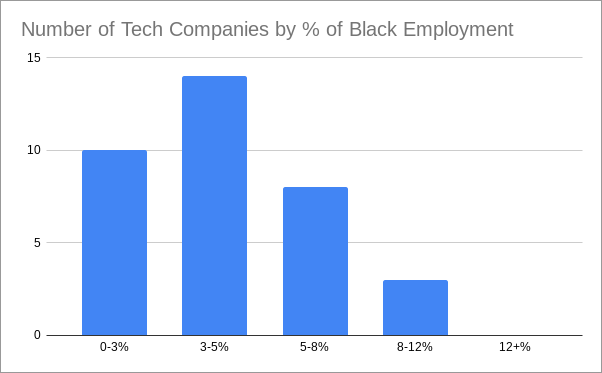
Not a single company in our data has more than 12 percent Black employees. And 67 percent of companies have fewer than 5 percent Black employees while 89 percent of companies have fewer than 8 percent. Compound this with the underrepresentation in tech leadership, and a startling picture emerges of how people of color truly don’t have a seat at the table in tech. In fact, they’re not even at the restaurant.
What You Can Do to Help

In tech, we’re not even at stage one of ensuring diversity and inclusion. We’re still at step zero. Step one can only begin when there is data readily available so we can learn what works and what doesn’t in promoting diversity and inclusion.
All companies with 100 or more US employees have to file an EEO-1 with the government every year. The EEO-1 breaks out employee counts by race, job category (manager, professional, laborer, etc.), and pay. Of the 57 companies I looked at, 16 publicly shared their EEO-1 but withheld payment information by race and gender. Only one company, Intel, also shared pay data.
There is no good reason that a company should withhold their demographic EEO-1 data (the most common reason they give is to protect trade secrets, but that’s a bunch of nonsense). Every company in this dataset talks about diversity and readily uses pictures of people of color on their employment pages. Most even have a diversity and inclusion officer.
They sure know how to make it look like they care about diversity in their companies. Frankly, it’s time to put up or shut up. Unless there is external accountability and both demographic and experiential data sharing will we move forward. For example, there are platforms that capture real‑time candidate feedback across hiring stages—helping companies understand not just who they hire, but how different groups experience the process..
As a tech employee, demand accountability
If you work at a tech company and you have more than 100 US employees at your company, you should demand accountability from those in charge. Write an email to your executive leadership requesting they release their 2018 EEO-1 demographic data (2019 was postponed to 2021 due to Covid). Ask your colleagues to do the same. Here’s an email you can use:
Example
“Hello (name),
I know as a company we’re committed to having a diverse and inclusive workplace. To further that commitment, I strongly believe we should be transparent about our progress toward that mission. To that end, I think we should publicly share our EEO-1 demographic data.
This will enable us to keep ourselves publicly accountable for our goal. It will signal to prospective employees that we are truly committed to becoming more diverse.
Thanks,
(Your name)”
If you succeed, please send the EEO-1 my way so I can add it to this post.
As a business leader, share your EEO-1
If your company has 100 or more employees, send me your EEO-1. If you have less than 100 employees, send me the breakout of your company and leadership by race. If you have any questions, please reach out.
Send it to me. Send it as an image, a PDF. Send it via carrier pigeon or mail a hand-written note in hieroglyphics. I don’t care. The more data we have, the quicker we can act on that data.
Better yet, please send your diversity data to [email protected], and I’ll update this page to include your information.
Open Diversity Data Project

I want to publicly share the source of my data for two reasons:
- So others can continue this analysis
- To hold tech companies accountable
I want this to be a living document. I want all tech companies to publicly share their diversity data so that it can be analyzed and scrutinized by people smarter than me. Please send your diversity data to [email protected], and I’ll update this table with your information.
With that said, here is where I got my data for my analysis (a blank cell means I couldn’t find anything for the given company):
| Company | EEO-1 | Year | Self-Reported | Year |
| HubSpot | Report | 2020 | ||
| Lyft | EEO-1 | 2017 | Report | 2019 |
| Amazon | EEO-1 | 2014 | Report | 2019 |
| EEO-1 | 2018 | Report | 2020 | |
| EEO-1 | 2018 | Report | 2019 | |
| Netflix | Report | 2020 | ||
| Intel | EEO-1 | 2018 | Report | 2019 |
| Salesforce | EEO-1 | 2018 | ||
| Booking Holdings | ||||
| Uber | Report | 2019 | ||
| Expedia | ||||
| Adobe | Report | 2019 | ||
| eBay | EEO-1 | 2018 | Report | 2019 |
| Wayfair | Report | 2019 | ||
| Chewy | ||||
| Square | Report | 2017 | ||
| Workday | Report | 2019 | ||
| ServiceNow | EEO-1 | 2018 | Report | 2019 |
| GoDaddy | Report | 2019 | ||
| Zillow | ||||
| Airbnb | EEO-1 | 2018 | ||
| Groupon | ||||
| Newegg | ||||
| Microsoft | EEO-1 | 2018 | Report | 2019 |
| Apple | EEO-1 | 2018 | Report | 2018 |
| Dell | Report | 2019 | ||
| IBM | ||||
| Lenovo | Report | 2019 | ||
| Match Group | ||||
| Copart | ||||
| Instacart | ||||
| Wish | ||||
| Snap | ||||
| Stitch Fix | ||||
| Tripadvisor | ||||
| Overstock | ||||
| Zynga | ||||
| GrubHub | ||||
| Verisign | ||||
| EEO-1 | 2018 | Report | 2019 | |
| Twilio | Report | Not sure | ||
| Yelp | Report | 2019 | ||
| DocuSign | ||||
| Oracle | Report | Not sure | ||
| Slack | Report | 2019 | ||
| Buffer | Not sure | |||
| Cisco | EEO-1 | 2018 | Report | 2019 |
| 23andme | 2020 | |||
| HPE | EEO-1 | 2016 | Report | 2019 |
| Intuit | EEO-1 | 2016 | Report | 2019 |
| Nvidia | Report | 2020 | ||
| Dropbox | Report | 2019 | ||
| Tesla | ||||
| Autodesk | Report | 2020 | ||
| Citrix | EEO-1 | 2018 | Report | 2019 |
| Red Hat | Report | 2020 |
Footnotes
- I looked at the largest US-based internet and technology companies and tried to obtain their employment statistics by race. I also included two smaller companies (Buffer and 23andme that I knew reported on diversity data). First, I tried to find recent EEO-1s for each company. The EEO-1 is a standardized form that US companies with greater than 100 employees have to file with the US government each year. Only 17 of the 57 companies I analyzed publicly shared this information. 16 of the companies had EEO-1s from 2016, 2017, or 2018 so they were included in my dataset. Due to Covid, 2019 EEO-1s don’t have to be filed until 2021. One company, Amazon, hasn’t shared their EEO-1 since 2014 so I used their self-reported data instead. If a company didn’t share their EEO-1, I looked to see if they self-reported diversity numbers on their website. In total, 19 companies that didn’t disclose their EEO-1 self-reported diversity numbers to some degree. Unfortunately, these weren’t standardized. I wanted the breakdown of racial composition for leadership positions, tech positions, non-tech positions, and overall company makeup. I’ll detail my methodology for how I standardized self-reported diversity data for different comparisons I do throughout this article.
- These scatterplots use data from 33 companies. Data for 16 of these companies come from their self-reported EEO-1s. 13 of these EEO-1s are from 2018, 1 is from 2017, and 2 are from 2016. The EEO-1s require that companies break out their employee counts by different job classifications. We categorized all “Executive/Sr. Officals & Mgrs” and “First/Mid Officials & Mgrs” as leadership. For the remaining 17 companies, we relied on self-reported diversity data. All 17 of these companies gave the percentages (not totals) of employees by race at the overall company and the percentage of employees by race in leadership. Unfortunately, the definition of “leadership” changes from company to company (and sometimes companies don’t define that term when they share this data), so the comparison isn’t directly apples to apples across companies. Still, it is helpful in looking at the racial composition of employees in power in tech relative to the overall composition of these companies. 5 of the companies that self-reported gave data from 2020, 11 from 2019, and 1 from 2017.
- Per the second footnote above, we can only get counts of employees in leadership positions by race through an EEO-1. Since companies that self-report diversity data only report percentages and don’t rigorously define “leadership,” there is no way to aggregate counts across those companies.
- In total, our data has 645,996 employees. For 16 of the 35 companies, we used the EEO-1 mentioned in footnotes (1) and (2). For the other 19 companies, we relied on their self-reported data on the makeup of their companies by race. These companies don’t give total employee counts by race so to approximate employee counts, I looked at the total number of US-based employees on LinkedIn at the time in which each company self-reported their data. While not a perfect measure, it’s a reasonable approximation for US employee count. For this analysis, we excluded Amazon, which totals 183,322 employees. The reason being that the majority of their workforce is concentrated in their warehouse (lower paying jobs) unlike all other companies in our data. Their most recent EEO-1 from 2014 shows that 53.8 percent of their workforce are “Laborers & Helpers” and people of color are largely over-represented in this workforce so including them severely and in my opinion, unfairly, overstates representation of people of color in tech.
- US population data comes from the US Census.

Stephen is the co-founder and CEO of BeamJobs. Frustrated with the challenges he'd faced in his own job search, he left the corporate world to start BeamJobs with his brother. Drawing on firsthand experience with hiring and getting hired as technical talent, he started BeamJobs in 2020 to help qualified job seekers land interviews with less stress. Since then, more than 4 million people have built their resumes and cover letters on BeamJobs. Stephen's insights have been featured in notable outlets, such as Fast Company, Business Insider, Yahoo Finance, MIT, and Zapier. Learn more about Stephen.